Back to mainpage

We achieved an 18% reduction in 2024 compared to 2023


Establishment of Science Based Targets
We already decided our target for scope 1 and 2 in 2023, namely to achieve a 50% reduction in 2030 compared to 2022. With total insight into our scope 3 emissions, we were also able to set a target for this.
Our goal is to reduce the impact of our packaging by 42% in 2030 compared to 2023.
These targets are currently being reviewed by the Science Based Targets initiative (SBTi), and we expect to receive their response in the course of 2025.
To contribute to global climate goals, we have set our targets using Science Based Targets (SBT). Science Based Targets are emission reduction goals that are aligned with what climate science says is required to limit global warming. As a result, we can be sure that our objectives contribute sufficiently to the world’s overall efforts.


Scope 2
Electricity for company and
lease cars
Scope 2
Electricity
Scope 1
Trucks and
diesel vans
Scope 1
Natural gas
Scope 1
Company and
lease cars
41
34
35
1.587
2.265
2.149
1.287
1.489
1.740
336
323
441
431
388
439
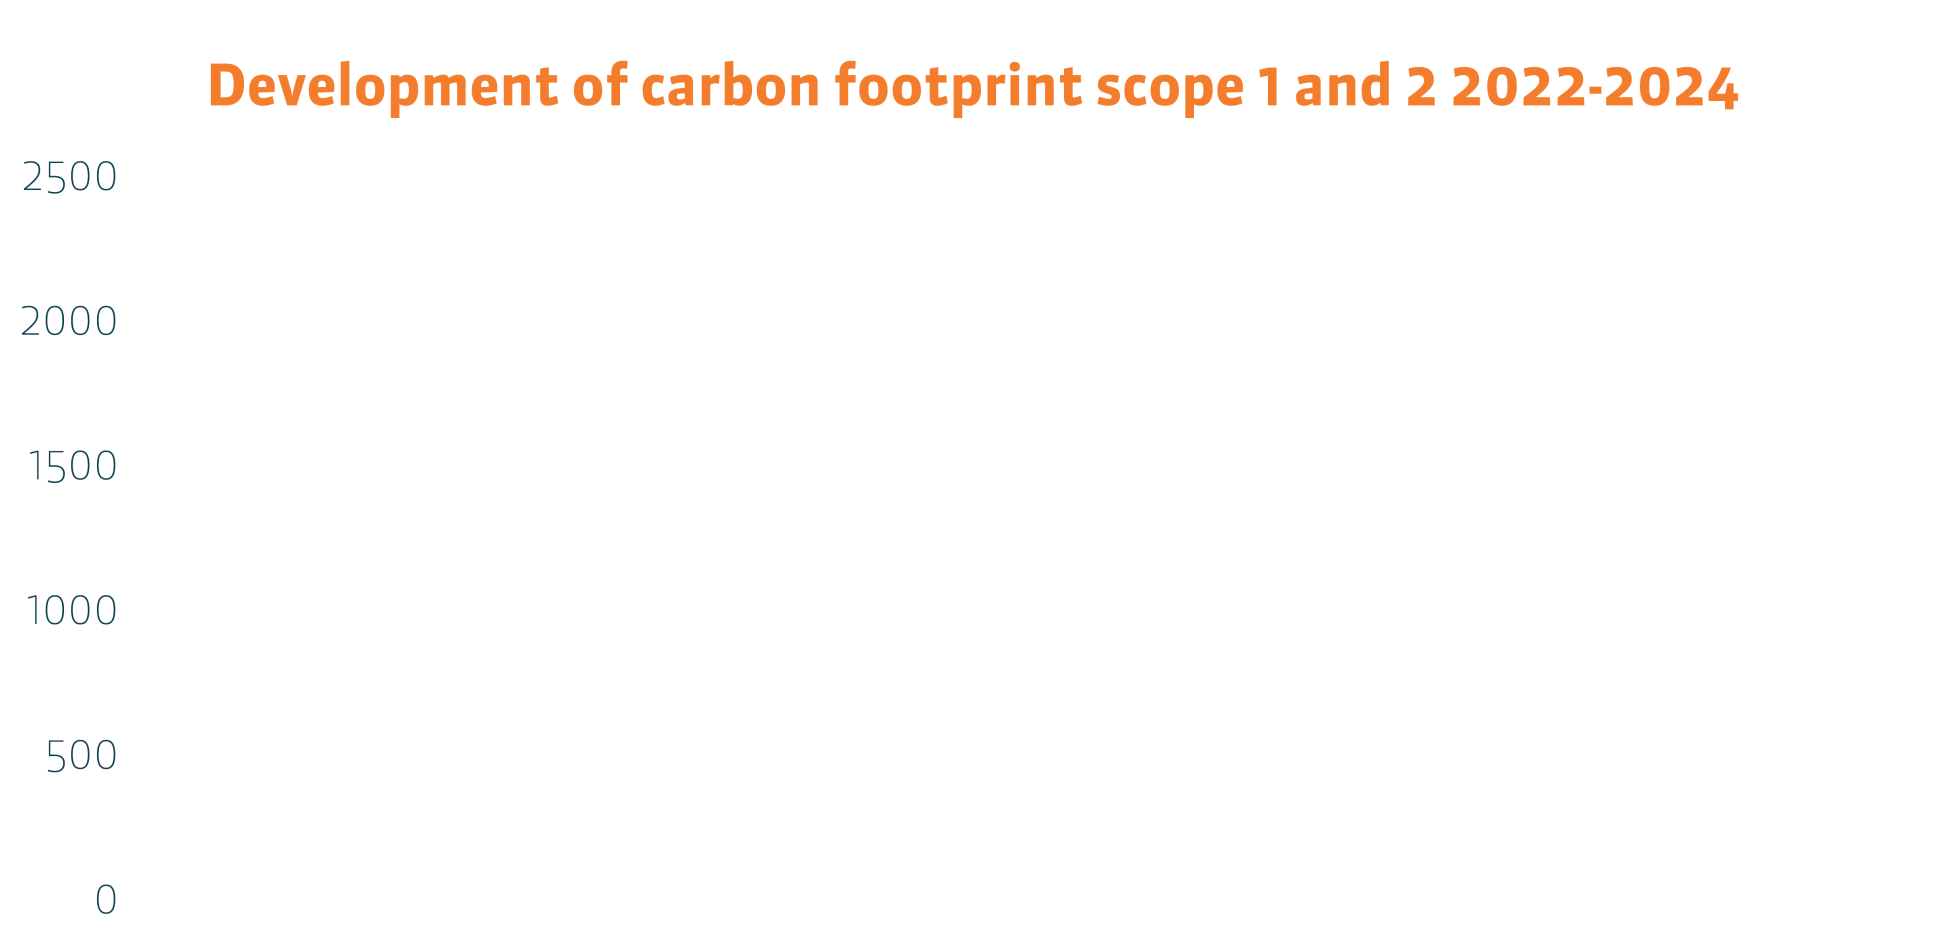
Organisation carbon footprint (scope 1 and 2)
As in previous years, we have determined our organisation’s carbon footprint based on our electricity and fuel consumption . We achieved an 18% reduction in 2024 compared to 2023. This can largely be explained by the purchase of green electricity from nuclear energy for some of our buildings, which has resulted in a total reduction of 30% in electricity emissions. And just like previous years, we see the share of electric cars in our fleet increasing, affecting these emissions to increase by 20% compared to 2023.
When we look at our reduction target of 50% in 2030 compared to 2022, we see a nice downward trend. In 2024, our scope 1 and 2 footprint was 23% lower than 2022.
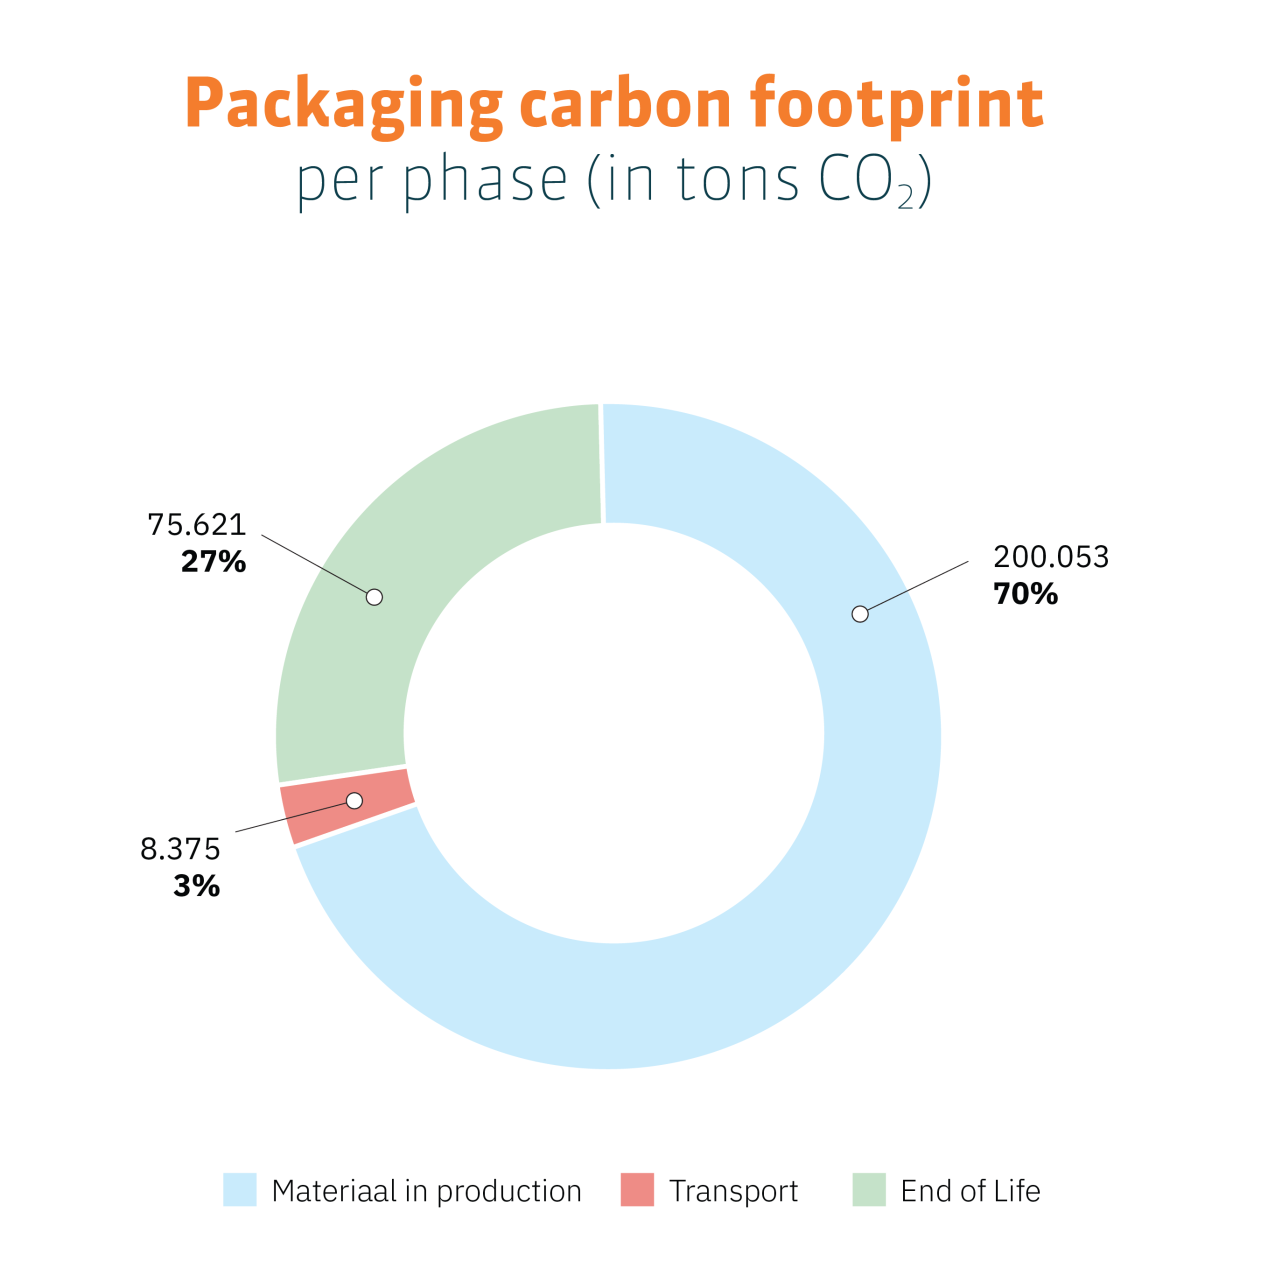
Packaging emissions are by far the largest
The graph below shows the carbon footprint of our packaging for 2023. It can be seen that the greatest impact is in the production and material phase. We can have a major influence on this by making conscious choices in materials and design, such as adding recycled plastic. In 2025, we will work with the divisions on a concrete action plan to develop the reduction steps. More information about how we make our products more sustainable can be found in the assortment classification paragraph.
Now that it has become clear that our greatest impact is in our packaging and related products, this emission deserves some further explanation. Our scope 3 emissions calculation for packaging looks at the material type, production process, country of origin and waste stage. We calculated the carbon emissions of these phases for each product, which means we now have insight into how these emissions are distributed and what the most important steps are to reduce them.
What are Scope 1, 2 and 3 carbon emissions?
Scope 1: Direct emissions by the company, such as emissions from vehicles and trucks.
Scope 2: Indirect emissions from purchased energy, such as electricity.
Scope 3: Emissions in the value chain, such as purchased products, employee commuting, transportation in the supply chain, waste processing, and air travel.
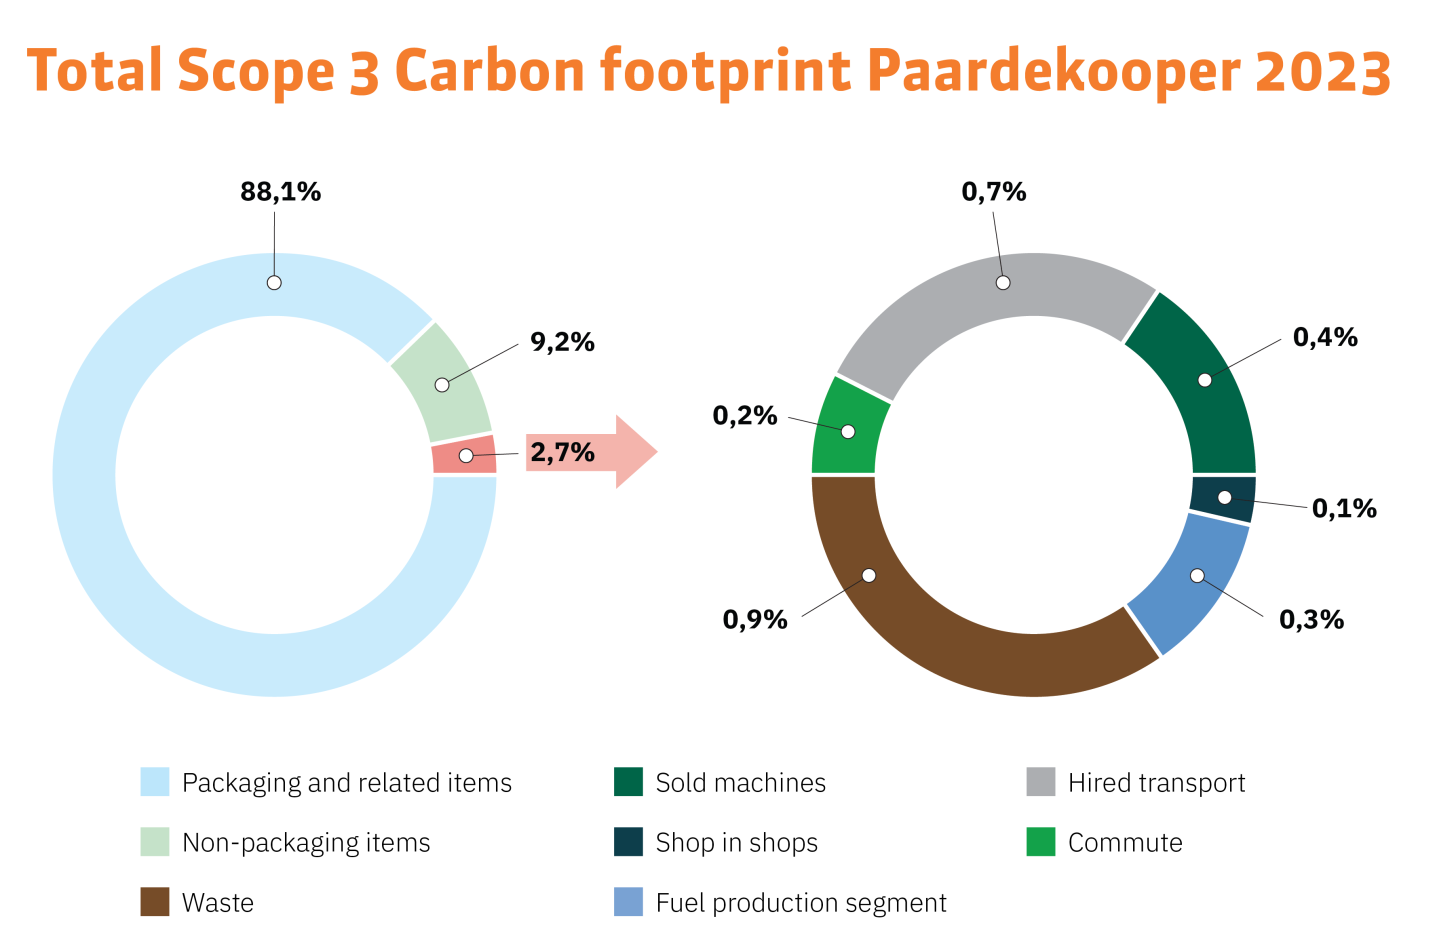
Total Scope 3 emissions calculated
Our carbon footprint
Our products are responsible for as much as 97% of our total scope 3 emissions. 88% of this is our packaging and related products. In addition, 9% comes from non-packaging products, which form a wide range of floristry and retail items for example. The remaining 2.7% comes from, for example, hired transport, waste, commuting and air travel.
It is clear that the majority of our emissions come from the material, production, transport and waste phase of the products we purchase. This insight makes it clear that the sustainability of our range, which we have been working on for years of course, remains as important as ever.
We calculated our total Scope 3 emissions based on 2023 data by following the guidelines of the Greenhouse Gas Protocol (GHG Protocol). These guidelines help companies consistently map and report all their emission sources. By calculating all the categories, we obtained a complete picture of our carbon footprint. It is now clear that our scope 1 and 2 emissions are only 1% of our total footprint. However, even though this figure is small, we remain directly responsible for our scope 1 and 2 emissions and we continue to seek to reduce them.