Scroll down
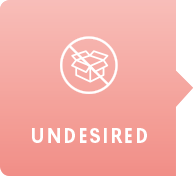
Products are no longer aloud based on (future) law & regulations

12,8%

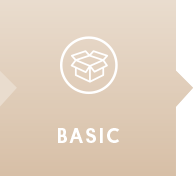
Products are not recyclable or materials are not of responsible origin
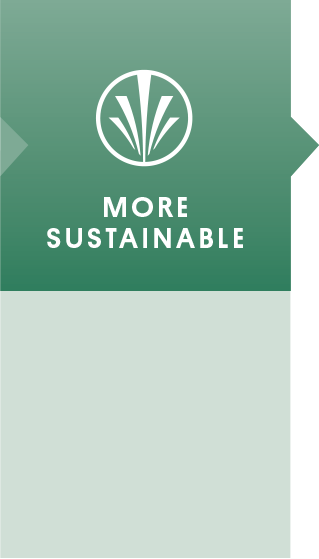
Products are recyclable on large scale and/or consist of bio-based materials of responsible origin
Products are recyclable and consist of more than 35% recycled material or are reusable
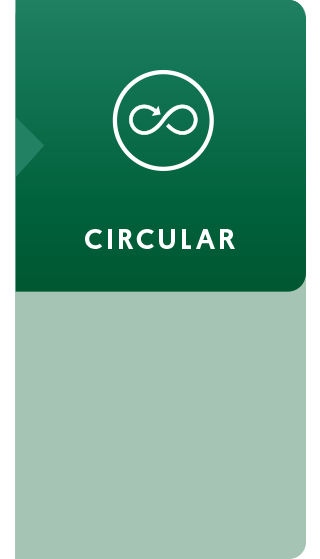
Products are reusable and traceable in a circular loop system
0,4%

8,5%

35,2%

43,1%

Electricity
Company and lease cars
TRUCKS
Electric company and lease cars
GAS
Reduce energy consumption


2022
2021

Step-by-step implementation
of the assortment classification
This tool is updated based on
new legislation and guidelines.
Version: April 2022
Read more


Improvement of product sustainability
We have created an assortment classification which allows us to clearly and unambiguously classify our products in terms of (level of) sustainability.
We aim to demonstrably improve the sustainability of our assortment through smart, circular packaging, packaging systems and services.


Solar panels on office buildings
LED lighting in buildings
Going gas-free after store modernisations
Project zero: We are taking steps to reduce our own waste stream.
Sustainable newbuilds
Step by step we are taking measures
to make our business operations more sustainable and reduce our footprint:
Electric company and lease cars
Electricity
TRUCKS
Company and lease cars
GAS
2.130
22
1.740
420
632
2.293
11
1.539
508
704
Scope 3: CO2 emissions in the supply chain
Scope 3 emissions cover all of the emissions that we create through our product purchases, as well as through air travel and external transport services, for example. While we have no direct influence over these emissions, we are in a position to make conscious choices about them. In 2023 we will gain insight in our scope 3 emissions, which should allow us to focus on their reduction.
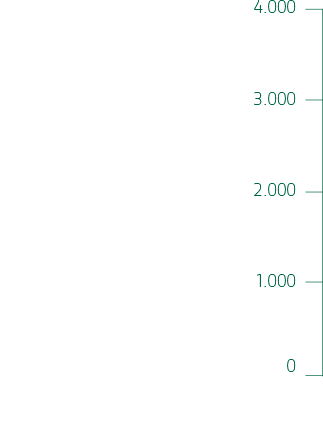
CO2-footprint for 2021 versus 2022
CO2 emissions (in tonnes)
Scope 1 AND 2:
the organisation's CO2 emissions
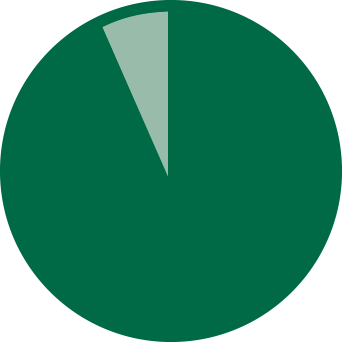
Our CO2 emissions originate mainly from the gas and electricity used on our premises and the petrol and diesel used by our trucks and lease cars. The graph (side) shows our scope 1 and 2 CO2 footprint for 2022, and the graph below shows the trend since 2021. The CO2 footprint for 2022 (4943 tons) is more than 2% below that for 2021 (5055 tons). The decrease is mostly due to the 10% lower gas consumption.
This saving was made in the Horti division and is mainly due to our mid-year relocation to more economical premises. We are also seeing lower emissions from our lease fleet, which reflects our phasing out of diesel cars and growing uptake of electric. Some of our electricity is from solar panels on the roof, and the portion shown below is from non-renewable sources. The purchase of green electricity on a large-scale is therefore an important action point in the years to come.
CO2-footprint 2022 (scope 1 and 2)
shown in percentages
In 2023 we will recalibrate our CO2 reduction targets on the strength of this data and draw up a specific action plan complete with measures. We will do this in accordance with the requirements of the Science-based Target initiative, through which we will ensure that our objectives make an adequate contribution to the Paris climate goals.
We consider it our responsibility to reduce our organisational CO2 footprint as far as possible.
OUR CO2 FOOTPRINT
The impact of our organisation
5%
95%
PEF
Product footprint
OEF
Operational footprint
Environmental impact

‘The lower emissions from our lease fleet show that we are phasing out diesel cars and taking up more electric.’

5/11

ENVIRONMENT


ENVIRONMENT

We reduce our
environmental impact

We aim to reduce our environmental impact. We see this in terms of our Product Environmental Footprint (PEF) and Operational Environmental Footprint (OEF). As a wholesaler with only a small proportion of in-company production, about 95% of our total environmental impact is due to our products and 5% to our organisation.